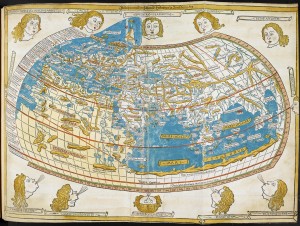
Claudius Ptolemy (c.90-c.168)
World Map in Cosmographia, Ulm, 1482
British Library, London
© The British Library Board (IC.9303)
There was a stunning exhibition of rare maps on display at the National Library during the summer of 2014.
Exquisite hand-painted medieval atlases, detailed sea charts, polished globes and intricate survey sketches – all presenting complex information in a clear and captivating way.
Seeing these images from another age reminded me of the power of pictures in communication.
Our brains process images more efficiently than text.
As well as requiring less mental effort to decode, picture-based communication can also increase comprehension, recall and retention.
This means we can use contemporary visual information ‘maps’ such as diagrams, illustrations and infographics to communicate more effectively.
A well placed diagram can convey the same information as half a page of text and get the message across at a glance. For example, consider:
- a pie chart showing target audience segments or the breakdown of financial expenditure
- a flow chart illustrating how elements of a strategy fit together and inform each other
- a pyramid explaining the hierarchy of actions or key messages
- a diagram outlining project phases alongside corresponding processes and measures of success.
An added advantage is that clear, simple diagrams provide visual relief from large blocks of text and can also be used in presentations and summaries.
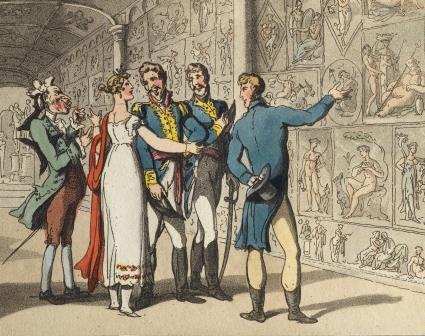 A great image can catch the eye, engage your readers and help tell your story. There are plenty of stock images online but if you’re after something different, check out Getty’s Open Content Program.
Around 10 000 images from the J Paul Getty Museum and the Getty Research Institute are available. There is no charge and no permission required. You can even crop and otherwise alter the images.
The Open Content Program includes paintings, drawings, manuscripts, photos, antiques, sculpture, decorative arts, artists’ sketchbooks, water colours, rare prints from the 16th–18th century, and 19th century architectural drawings of cultural landmarks.
The delightful digital image above is courtesy of Getty’s Open Content Program.
It’s a detail from the 1815 print, Don Luigi meets Donna Anna in the museum.
In the last three years, the number of Google searches for the term infographics caught up to, and even exceeded, searches for email marketing and content marketing.
Good infographics serve up complicated information in a more digestible way.
They can:
- spice up statistics
- demystify complex subjects
- explain detailed processes and policies
- highlight key data or patterns in the data.
As author, data journalist and information designer David McCandless says: ‘By visualising information, we turn it into a landscape that you can explore with your eyes, a sort of information map. And when you’re lost in information, an information map is kind of useful’.
A whole industry has sprung up around data visualisation. There are websites that generate new infographics every day and various tools to create your own.
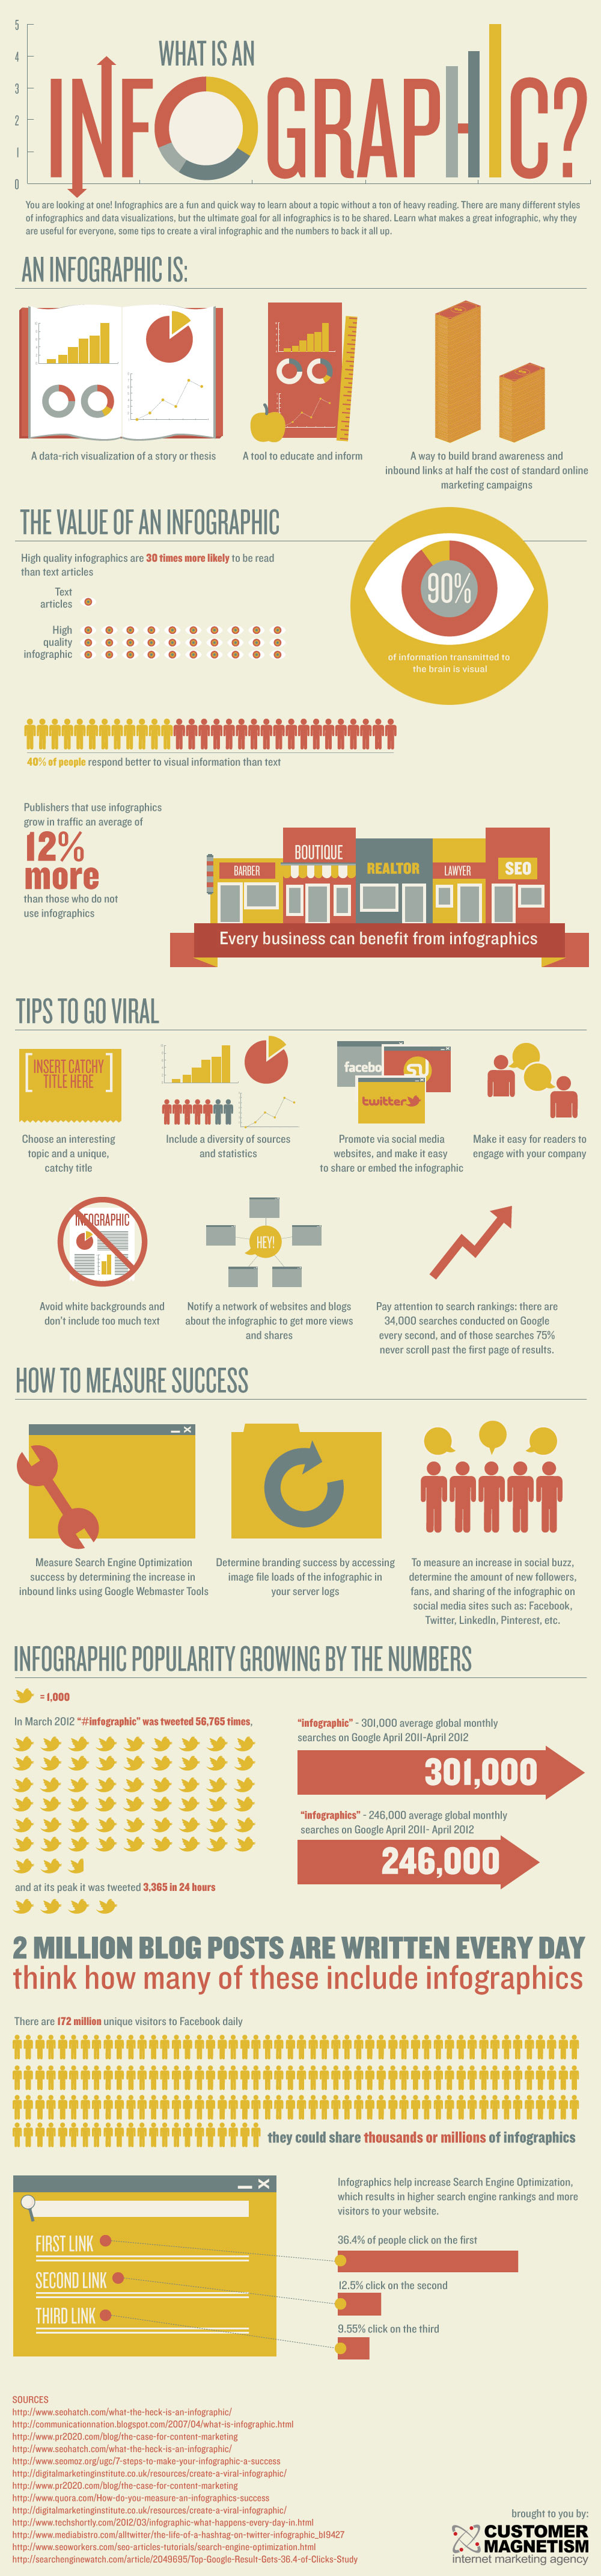
There are even infographics on infographics. According to the one below:
- 90% of information transmitted to the brain is visual
- high quality infographics are 30 times more likely to be read than text articles.
Mmmmm… perhaps I should have summarised this article as an infographic. ;-)
Need help expressing your messages clearly? Contact Cinden for help with your next project.
| Cinden Lester has more than 25 years’ experience as a professional writer, editor and communications strategist. She worked as a broadcast journalist, in private sector marketing and public relations, and in government communications before establishing her own Canberra-based communications consultancy. |